Unlimited networks (I)
Suppose you have 100 nodes; each of them has its own x and y spatial coordinates. You are interested in learning how the spatial structure of the network composed of the nodes and the edges forming between them affects the system dynamics. Unfortunately, you have no clue whether there is an edge between any two nodes and, therefore, cannot conclude the configuration of the spatial network. What should you do to generate testable/hypothetical networks in order to answer the interesting question you have in mind?
An intuitive solution is, based on the knowledge you have about the system, deciding whether there is an edge between two nodes. Let’s say, if the geometric distance between any two nodes is smaller than d (kilometers), the two nodes are connected. Otherwise, they are not. A matrix accommodating such information is an adjacency matrix. We will make one in this post.
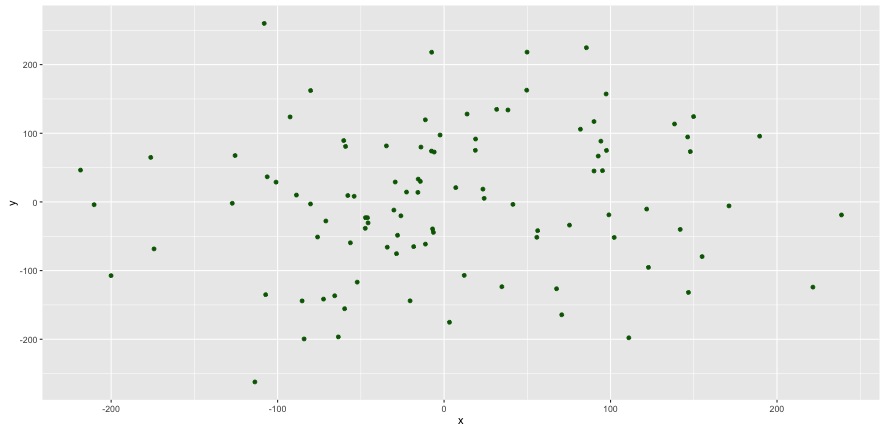
Before that, let’s reproduce the nodes data in the above plot.
set.seed(5)
x = rnorm(100) * 100
y = rnorm(100) * 100
data = data.frame(x, y)
We also need a distance matrix that helps us generate an adjacency matrix in future steps.
dist <- as.matrix(dist(data))
Let’s set up d = 20. That is, two nodes of which distance smaller than 20 km are connected.
DM <- dist[] < 20
diag(DM) = 0
If you type
DM
in R console, you have an adjacency matrix. Isn’t it easy?
We can write a function in R, which generates adjacency matrices based on the threshold distance d.
nt <- function(d) {
    DM <- dist[] < d
    diag(DM) = 0
    return(DM)
}
With lapply, we can generate as many adjacency matrices as we want.
thresholds <- seq(5, 10, 0.1)
lapply(thresholds, nt)
This is a great first step. It can be the basis of generating more matrices, making networks and computing network properties. We can go on to explore more. Continue.